2021年1月30日 星期六

2021年1月24日 星期日

vba:換行跟常用的符號

 整理給自己查,也作分享

chr指令 VBA常數         英文定義
chr(8) vbBack
chr(9) vbTab         tab
chr(10) vbLf                 newline (line feed)
chr(12) vbFormFeed form feed
chr(13) vbCr             return (carriage return)
chr(34)     "                        


2021年1月18日 星期一

VBA:用LINE NOTIIFY 作股價追踪


網路上已有相當多類似的作品了,小小編參考了廣大網路資源,做了一個自己專用的,成果如圖1.

圖1.成果
說明:嘗試以多VBS控制同一工作表,做動態股價更新;當股價有異動發通知到手機上;缺點就是LINE NOTIIFY每小時僅能1000則訊息,真要命;再來多測試測試。

下一步改成股價有異動時,傳送照片好了,這樣可以節省傳送次數。

技術點:
1.要讓VBA生成VBS專用的字串,配合文字檔案的生成,把指令寫進去。
2.物件連動也需寫入VBS中。
3.讓VBS具備多SUB功能,自主控制與判斷,達到類似多緒用途。

1/20更新:
透過RANGE.COPYPICTURE的方法做照片複製,不穩定讓我充滿了遺憾,僅能宣告失敗。
解決之道:
在小編放鬆後,思考既然是限制1000則,不然就讓訊息彙整變成一則吧!
以大盤!TWII指數變化為例,當變化時就取得指定股別得所有成交資料傳到LINE NOTIIFY上。
圖1.成功^ㄡ^


2021年1月13日 星期三

VBA:連結;Hyperlinks

 最基本的參數參:Hyperlinks.AddHyperlinks 物件

小編最常用的是連結開啟檔案、連結MAIL、連結網站、連結工作表的儲存格

寫給自己看,也作分享

連結開啟檔案:

SOURCE_SHEET=ACTIVESHEET.NAME
Sheets(SOURCE_SHEET).Range("B" & i).Hyperlinks.Delete
Sheets(SOURCE_SHEET).Range("B" & i).Hyperlinks.Add Anchor:=Sheets(SOURCE_SHEET).Range("B" & i), Address:=FILE_PATH, _
TextToDisplay:="'" & Sheets(SOURCE_SHEET).Range("B" & i).Value '"'"是避免數字錯誤。
view raw gistfile1.txt hosted with ❤ by GitHub

FILE_PATH:是檔案路徑
連結MAIL:參考:Hyperlinks.Add


連結網站:參考:Hyperlinks.Add


連結工作表的儲存格:

 ActiveSheet.Hyperlinks.Add Anchor:=Selection, Address:="", SubAddress:= _

        "'工作表名稱'!儲存格位置如A1", TextToDisplay:="鉀肥"


stock:工作表名稱的變數

2021年1月12日 星期二

花蓮:九曲洞+天祥


花蓮:三仙台+成功海殯公園


三仙台:


成功海殯公園:


VBA:即時技術分析+即時股價 V2


圖1.
說明:V2版做了一些調整,因為有用到網路資源,增加多線路查詢功能,以及下拉式選單做快速概念股查詢、還有交易量也一起騰上去了;上一版的無人置守功能也完成了,再思考要用到價通知好還是用技術分析走勢判定結果來通知@@。

圖2.下拉式選單
說明:主要增加部分。


2021年1月11日 星期一

VBA:新增與刪除定義名稱

 想寫一個自動更新折線圖的資料,最簡單的方法就是加入"定義名稱",透過"定義名稱"來控制折線圖的資料區間。

主要要使用到WORKBOOKS的NAME屬性來新增。MSDN

主要語法:

ActiveWorkbook.Names.Add Name:=名稱, RefersTo:=參照儲存格位置

名稱可以自訂,參照儲存格位置這邊建議寫完整一點,才不會出包。

EX: 

ActiveWorkbook.Names.Add Name:="TEST", RefersTo:="=" & "OSC" & "!$" & "A" & "$2:" & "$" & "A" & "$" & 10

新增一個名為TEST的定義名稱,參照 OSC工作表的A2:A10儲存格。

指定刪除:

ActiveWorkbook.Names(定義名稱).Delete

全部刪除:

Dim Name_UNIT As Name

For Each Name_UNIT In Application.ActiveWorkbook.Names

       Name_UNIT .Delete

Next


2021年1月10日 星期日

VBA:水平置中、垂直置中與其他設定

寫給自己速查  

垂直屬性:HorizontalAlignment 

水平屬性:VerticalAlignment 

置中:xlCenter

靠左靠右:XLLEFT、XLRIGHT

Sheets("工作表1").Range("m2").VerticalAlignment = xlCenter

  Sheets("工作表1").Range("m2").HorizontalAlignment = xlCenter

  Sheets("工作表1").Range("m2").VerticalAlignment = XLRIGHT

  Sheets("工作表1").Range("m2").HorizontalAlignment = XLRIGHT

  Sheets("工作表1").Range("m2").VerticalAlignment = XLLEFT

  Sheets("工作表1").Range("m2").HorizontalAlignment = XLLEFT

VerticalAlignment 

HorizontalAlignment 


VBA:即時技術分析+即時股價


圖1.

身為上班族,你是否跟我一樣有偷偷想掌握自己持股的需要,哈哈。
寫這個主要目的是希望用當天股市盤中的價格+歷史股價來滿足動態技術分析等期望。
小小編這兩天花了點時間,完成了這個EXCEL小工具,今天測試8檔股票花費時間為毫秒內完成。
功能說明:繪製20日DIM、DEM、OSC與股價線,繪製5K、5D線。
圖2.
DI/EMA12/EMA26:走勢判斷

DIE/DEM判斷:DIF與DEM走勢,誰強。
KD線判斷:KD誰強判斷
當日收盤、最高、最低顯示。

圖3.
圖4.
心情:有綠.....慘了。

下一步做動態股價自動更新跟LINE連動,滿足到價通知的功能。
來弄一個無人置守的追價工具。


2021年1月9日 星期六

股票+VBA:基本分析+技術分析

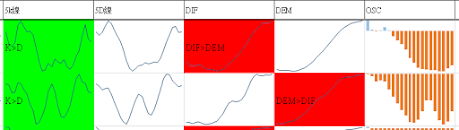
 最近有朋友在研究MACD的技術分析,就天冷沒出門做了一個。

圖1.技術分析
說明:配合基本分析的結果,多迷你圖視覺化下來,比較好閱讀。

圖2.基本分析(視覺)
說明:小小編自己做的基本分析
圖3.基本分析彙整表
說明:自己跑數據自己整理
下一步做一個簡易的動態追價工具。


VBA:一維陣列資料堆壘

經常有整理資料需要,自己寫給自己查詢用。
2個引數:陣列、結合符號
code:
Function ARRAY_Pile(INPUT_ARRAY, SYMBOL)
If IsArray(INPUT_ARRAY) = True Then
Dim ARRAY_STOCK_TOTAL As String
For i = LBound(INPUT_ARRAY) To UBound(INPUT_ARRAY) Step 1
If i = LBound(INPUT_ARRAY) Then
ARRAY_STOCK_TOTAL = INPUT_ARRAY(i)
Else
If INPUT_ARRAY(i) <> "" Then
ARRAY_STOCK_TOTAL = ARRAY_STOCK_TOTAL & SYMBOL & INPUT_ARRAY(i)
End If
End If
Next i
ARRAY_Pile = ARRAY_STOCK_TOTAL
Else
ARRAY_Pile = INPUT_ARRAY '2020.12.24 ARRAY_STOCK = 0
End If
End Function
view raw ARRAY_Pile.vba hosted with ❤ by GitHub


2021年1月8日 星期五

股票:美金與台股關係


圖1.
參圖,不多做說明。
期間:2009/01/06~2021/1/07
資料:最右邊為最近期間。

2021年1月3日 星期日

VBA 開啟檔案 (二) FileDialog應用:開盤、收盤價、最高、最低、成交量整理

想法:
看到某篇M01網友想要整理每日收盤開盤交易量等價格,就也寫一篇簡單教學文當參考。
想法:
找尋可以下載資料的網站,其次透過之前小編一篇文章的教學做資料整理。
先來下載2天份資料(下載),然後參考範本檔案做操作。
主要流程:開啟檔案>抓取資料>回寫表單>下一個檔案
作一個ACTIVEX按鈕插入以下VBA CODE。
VBA CODE:
Private Sub CommandButton1_Click()
Dim FILE_OPEN As FileDialog '宣告FILE_OPEN為檔案對話框
Set FILE_OPEN = Excel.Application.FileDialog(msoFileDialogFilePicker)
'設定FILE_OPEN為選取檔案功能
FILE_OPEN.InitialFileName = Excel.ActiveWorkbook.Path '對話框開始目錄的設定
FILE_OPEN.Filters.Add "Excel File", "*.xls*" '設定對話框要顯示的副檔名
FILE_OPEN.Filters.Add "所有檔案", "*.*"
FILE_OPEN.Show '顯示對話框
For I = 1 To FILE_OPEN.SelectedItems.Count
Source = Excel.ActiveWorkbook.Name '儲存目前作業中檔案名稱
FILE_OPEN_PATH = FILE_OPEN.SelectedItems(I) '取的檔案路徑
Workbooks.Open Filename:=FILE_OPEN_PATH '開啟案路徑
WORKNAME = Excel.ActiveWorkbook.Name '儲存新開檔案的檔案名稱
'新增的部分
S1 = ActiveSheet.Range("A2000").End(xlUp).Row
Data = ActiveSheet.Range("A2:H" & S1)
Windows(WORKNAME).Close '啟用新開檔案的檔案名稱
Windows(Source).Activate '啟用目前作業中檔案名稱
S2 = ActiveSheet.Range("A655360").End(xlUp).Row
If S2 = 1 Then
Sheets("工作表1").Range("A2:H" & S1) = Data
Else
Sheets("工作表1").Range("A" & S2 + 1 & ":G" & S1 + S2 - 1) = Data
End If
Next I
End Sub


結果:


圖1.結果


2021年1月2日 星期六

VBA:玩玩儲存格資料橫條顏色色階(AddDatabar)

老樣子來一下MSDN:FormatConditions.AddDataBar
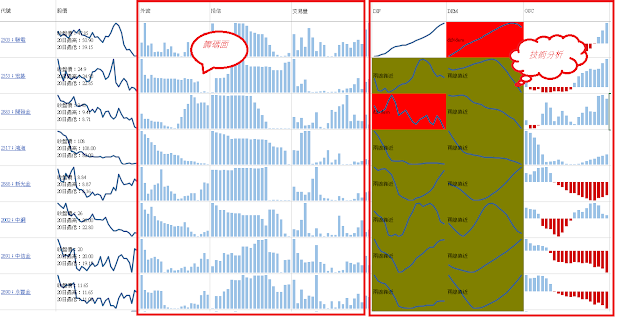


圖1.資料橫條圖(三大法人買賣%)
這是小小編自己在看3大法人買賣強度的橫條圖,比例數字表示跟前一天相比的百分比;綠表買,紅表賣。

先從簡單的開始:
VBA:
做一個VBA ACTIVEX 命令按鈕然後貼下以上代碼。

Private Sub CommandButton1_Click()
sheet_name = ActiveSheet.Name
Set rg = Sheets(sheet_name).Range("A" & 2)
rg.FormatConditions.Delete
rg.FormatConditions.AddDatabar
End Sub
參考結果:

圖2.基本練習
先跑刪除再新增,相當簡單。
rg1.FormatConditions.Delete
rg1.FormatConditions.AddDatabar


進階應用:
VBA:
一樣做一個VBA ACTIVEX 命令按鈕然後貼下以上代碼。

Private Sub CommandButton1_Click()
sheet_name = ActiveSheet.Name
END_FOR = Sheets(sheet_name).Range("a5000").End(xlUp).Row
For I = 2 To END_FOR Step 1
Set rg = Sheets(sheet_name).Range("A" & I & ":C" & I)
Min = Application.Min(rg)
Max = Application.Max(rg)
For Each rg1 In rg
If rg1.Value = 0 Then
rg1.FormatConditions.Delete
End If
If rg1.Value > 0 Then
rg1.FormatConditions.Delete
rg1.FormatConditions.AddDatabar
rg1.FormatConditions(rg1.FormatConditions.Count).ShowValue = True
rg1.FormatConditions(rg1.FormatConditions.Count).SetFirstPriority
With rg1.FormatConditions(1)
.MinPoint.Modify newtype:=xlConditionValueNumber, newValue:=0 'xlConditionValueAutomaticMin
.MaxPoint.Modify newtype:=xlConditionValueNumber, newValue:=Max * 1.5
End With
With rg1.FormatConditions(1).BarColor
.Color = RGB(255, 77, 64)
.TintAndShade = 0
End With
rg1.FormatConditions(1).BarFillType = xlDataBarFillGradient
rg1.FormatConditions(1).Direction = xlContext
rg1.FormatConditions(1).NegativeBarFormat.ColorType = xlDataBarColor
rg1.FormatConditions(1).BarBorder.Type = xlDataBarBorderSolid
rg1.FormatConditions(1).NegativeBarFormat.BorderColorType = _
xlDataBarColor
With rg1.FormatConditions(1).BarBorder.Color
.Color = RGB(255, 77, 64)
.TintAndShade = 0
End With
rg1.FormatConditions(1).AxisPosition = xlDataBarAxisAutomatic
With rg1.FormatConditions(1).AxisColor
.Color = 0
.TintAndShade = 0
End With
With rg1.FormatConditions(1).NegativeBarFormat.Color
.Color = 255
.TintAndShade = 0
End With
With rg1.FormatConditions(1).NegativeBarFormat.BorderColor
.Color = 255
.TintAndShade = 0
End With
If rg1.Value >= 3 Then
rg1.FormatConditions.Delete
rg1.FormatConditions.AddDatabar
rg1.FormatConditions(rg1.FormatConditions.Count).ShowValue = True
rg1.FormatConditions(rg1.FormatConditions.Count).SetFirstPriority
With rg1.FormatConditions(1)
.MinPoint.Modify newtype:=xlConditionValueNumber, newValue:=0 'xlConditionValueAutomaticMin
.MaxPoint.Modify newtype:=xlConditionValueNumber, newValue:=Max * 1.5
End With
With rg1.FormatConditions(1).BarColor
.Color = RGB(255, 77, 64)
.TintAndShade = 0
End With
rg1.FormatConditions(1).BarFillType = xlDataBarFillGradient
rg1.FormatConditions(1).Direction = xlContext
rg1.FormatConditions(1).NegativeBarFormat.ColorType = xlDataBarColor
rg1.FormatConditions(1).BarBorder.Type = xlDataBarBorderSolid
rg1.FormatConditions(1).NegativeBarFormat.BorderColorType = _
xlDataBarColor
With rg1.FormatConditions(1).BarBorder.Color
.Color = RGB(255, 77, 64)
.TintAndShade = 0
End With
rg1.FormatConditions(1).AxisPosition = xlDataBarAxisAutomatic
With rg1.FormatConditions(1).AxisColor
.Color = 0
.TintAndShade = 0
End With
With rg1.FormatConditions(1).NegativeBarFormat.Color
.Color = 255
.TintAndShade = 0
End With
With rg1.FormatConditions(1).NegativeBarFormat.BorderColor
.Color = 255
.TintAndShade = 0
End With
End If
End If
If rg1.Value < 0 Then
rg1.FormatConditions.Delete
rg1.FormatConditions.AddDatabar
rg1.FormatConditions(rg1.FormatConditions.Count).ShowValue = True
rg1.FormatConditions(rg1.FormatConditions.Count).SetFirstPriority
With rg1.FormatConditions(1)
.MinPoint.Modify newtype:=xlConditionValueNumber, newValue:=0
.MaxPoint.Modify newtype:=xlConditionValueNumber, newValue:=Min * 1.5
End With
With rg1.FormatConditions(1).BarColor
.Color = RGB(54, 191, 54)
.TintAndShade = 0
End With
rg1.FormatConditions(1).BarFillType = xlDataBarFillGradient
rg1.FormatConditions(1).Direction = xlContext
rg1.FormatConditions(1).NegativeBarFormat.ColorType = xlDataBarColor
rg1.FormatConditions(1).BarBorder.Type = xlDataBarBorderSolid
rg1.FormatConditions(1).NegativeBarFormat.BorderColorType = _
xlDataBarColor
With rg1.FormatConditions(1).BarBorder.Color
.Color = RGB(54, 191, 54)
.TintAndShade = 0
End With
rg1.FormatConditions(1).AxisPosition = xlDataBarAxisAutomatic
With rg1.FormatConditions(1).AxisColor
.Color = 0
.TintAndShade = 0
End With
With rg1.FormatConditions(1).NegativeBarFormat.Color
.Color = RGB(54, 191, 54)
.TintAndShade = 0
End With
With rg1.FormatConditions(1).NegativeBarFormat.BorderColor
.Color = RGB(54, 191, 54)
.TintAndShade = 0
End With
End If
Next
Next I
End Sub
參考圖3結果:多了顏色、最大最小值設定。
CODE相當多要設定,橫條圖效果才會顯著。
圖3.進階練習


指數變化(2025.03.20)

  指數變化(2025.03.20) 上周焦點: 美國紐約州製造業指數 -20 美國企業庫存月增率 +0.3% 美國零售額月增率  +0.1% FED 不升息 川普 名句:對等關稅是具備彈性的 本周愛看: 美國消費者信心指數 3/25 美國耐久財訂單月增率 3/26       ...